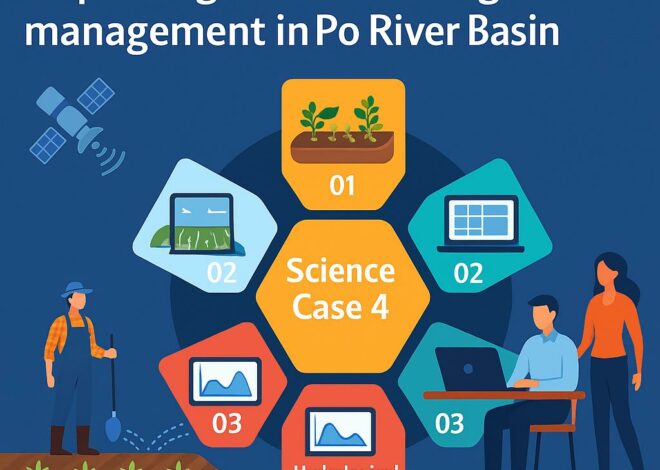
Science Case 5 (led by University of Trento): Water balance closure over all regions

Science Case 5 (led by University of Trento): Water balance closure over all regions

Although high-resolution satellite, hydrological, and land surface models are advancing, accurately understanding the water cycle in catchments remains challenging due to uncertainties in data accuracy, spatial variability, and the complex interactions between surface and subsurface processes. This science case leverages multiple state-of-the-art satellite datasets and hydrological/land surface models. We evaluated the water cycle closure for the Po River Catchment using 84 different combinations of precipitation, actual evapotranspiration (ET), and runoff. This assessment incorporated Earth-observed precipitation (CNR-IRPI combined product) and evapotranspiration (MODIS Terra), selected based on the round-robin evaluation conducted in WP4, along with outputs from six models—mHM, PCR-GLOBWB, CLM, TETIS, Wflow, and GEOframe—within WP5-Experiment 2. For the Rhine River Catchment, the evaluation included 40 combinations, based on the outputs of four hydrological models: mHM, PCR-GLOBWB, CLM, and Wflow_sbm. Similarly, for the Tugela River Catchment, 40 combinations were evaluated using outputs from the models: mHM, PCR-GLOBWB, TETIS, and Wflow_sbm. Fig. 1 shows the scheme of different combination over this study. The heatmaps in Fig. 2 present the primary results, showing annual water cycle residuals for various combinations of precipitation, ET, and runoff across the different catchments. Lighter shades of red or blue indicate smaller residuals, meaning a better closure of the water budget in each catchment.

Figure 1: Overview of different combinations of water cycle variables, integrating various hydrological models and Earth Observation (EO)-based data for Po, Rhine and Tugela Catchments.

Figure 2: Mean annual water cycle residuals calculated for each combination over the Po (a1), Rhine (b1), and Tugela (c1) catchments, based on individual data availability periods. Panels a2, b2, and c2 show residuals for the common data period (2007–2021) using EMO precipitation. Panels a3, b3, and c3 present the corresponding residuals for the same period (2007–2021), but using precipitation from the CNR-IRPI product, for the Po, Rhine, and Tugela catchments, respectively.

Leave a Reply

Your email address will not be published. Required fields are marked *